
AUD Breakdown: Nationality, Religion, Ethnicity, Gender
Alcohol Use Disorder (AUD) exists across every population, but prevalence and patterns vary depending on social, cultural, economic, historical, and biological factors. Large-scale surveys and public health organizations consistently show demographic differences in alcohol use and alcohol-related harms.
Key U.S. data primarily comes from the National Institute on Alcohol Abuse and Alcoholism (NIAAA) and the Substance Abuse and Mental Health Services Administration (SAMHSA). Global patterns are tracked by the World Health Organization (WHO).
By Race & Ethnicity (United States)
According to the 2024 National Survey on Drug Use and Health (NSDUH), summarized by NIAAA:
White Americans had among the highest overall prevalence rates of AUD (10.3%).
American Indian / Alaska Native populations had similarly high prevalence (9.8%), with researchers frequently linking elevated risk to historical trauma, poverty, discrimination, and reduced healthcare access.
Hispanic / Latino populations showed substantial variation across subgroups; overall prevalence was 9.1%.
Black / African American populations had rates similar to the national average (9.6%) but often experience disproportionately severe alcohol-related health consequences.
Asian Americans showed lower prevalence rates (5.5%), influenced partly by cultural norms and genetic differences affecting alcohol metabolism, including the alcohol flush reaction.
Sources: NIAAA – AUD by Demographic Characteristics | SAMHSA NSDUH Detailed Tables (Section 5)
By Nationality / World Region
According to WHO global alcohol reports and regional analyses:
Eastern European countries such as Russia and Belarus historically report some of the world’s highest per-capita alcohol consumption levels and elevated rates of alcohol-related disease.
Western Europe (including Germany and the UK) also has high alcohol consumption, though severe AUD rates tend to be somewhat lower than in Eastern Europe.
North America shows moderate-to-high prevalence of hazardous drinking and AUD.
The Middle East and North Africa generally show very low alcohol consumption rates due largely to religious prohibitions and legal restrictions.
East Asia historically has lower overall alcohol consumption, though rates are increasing in some countries.
Sub-Saharan Africa shows substantial variation, with some regions experiencing dangerous binge-drinking patterns despite lower average consumption.
Sources: WHO – Harmful Use of Alcohol | WHO Global Status Report on Alcohol and Health
By Religion
Religious affiliation strongly influences alcohol use patterns through cultural norms, moral teachings, and community expectations.
General patterns found in sociological and public health studies include:
Islam: Very low alcohol use and AUD prevalence because alcohol is explicitly prohibited.
The Church of Jesus Christ of Latter-day Saints: Lower rates due to strong abstinence teachings.
Evangelical Protestant groups: Lower-than-average alcohol consumption and binge drinking.
Catholic Church and mainline Protestant groups: Moderate use patterns closer to the general population.
Judaism: Generally associated with moderate and socially regulated alcohol use.
Religiously unaffiliated or secular individuals tend to report higher rates of alcohol use and AUD.
Researchers caution that religion influences behavior indirectly through culture, social support, stigma, and lifestyle expectations rather than through biology.
Sources: NIDA – Alcohol Overview | WHO – Harmful Use of Alcohol
Key Drivers Behind Demographic Differences
Researchers emphasize that differences in AUD prevalence are shaped by many overlapping factors, including:
Cultural attitudes toward drinking
Legal restrictions and alcohol availability
Socioeconomic stress and inequality
Historical trauma and discrimination
Family and community norms
Genetics and alcohol metabolism differences
Access to healthcare and treatment
Importantly, race and ethnicity are social categories rather than biological explanations for AUD.
Sources: NIAAA – Alcohol Facts and Statistics | WHO – Harmful Use of Alcohol
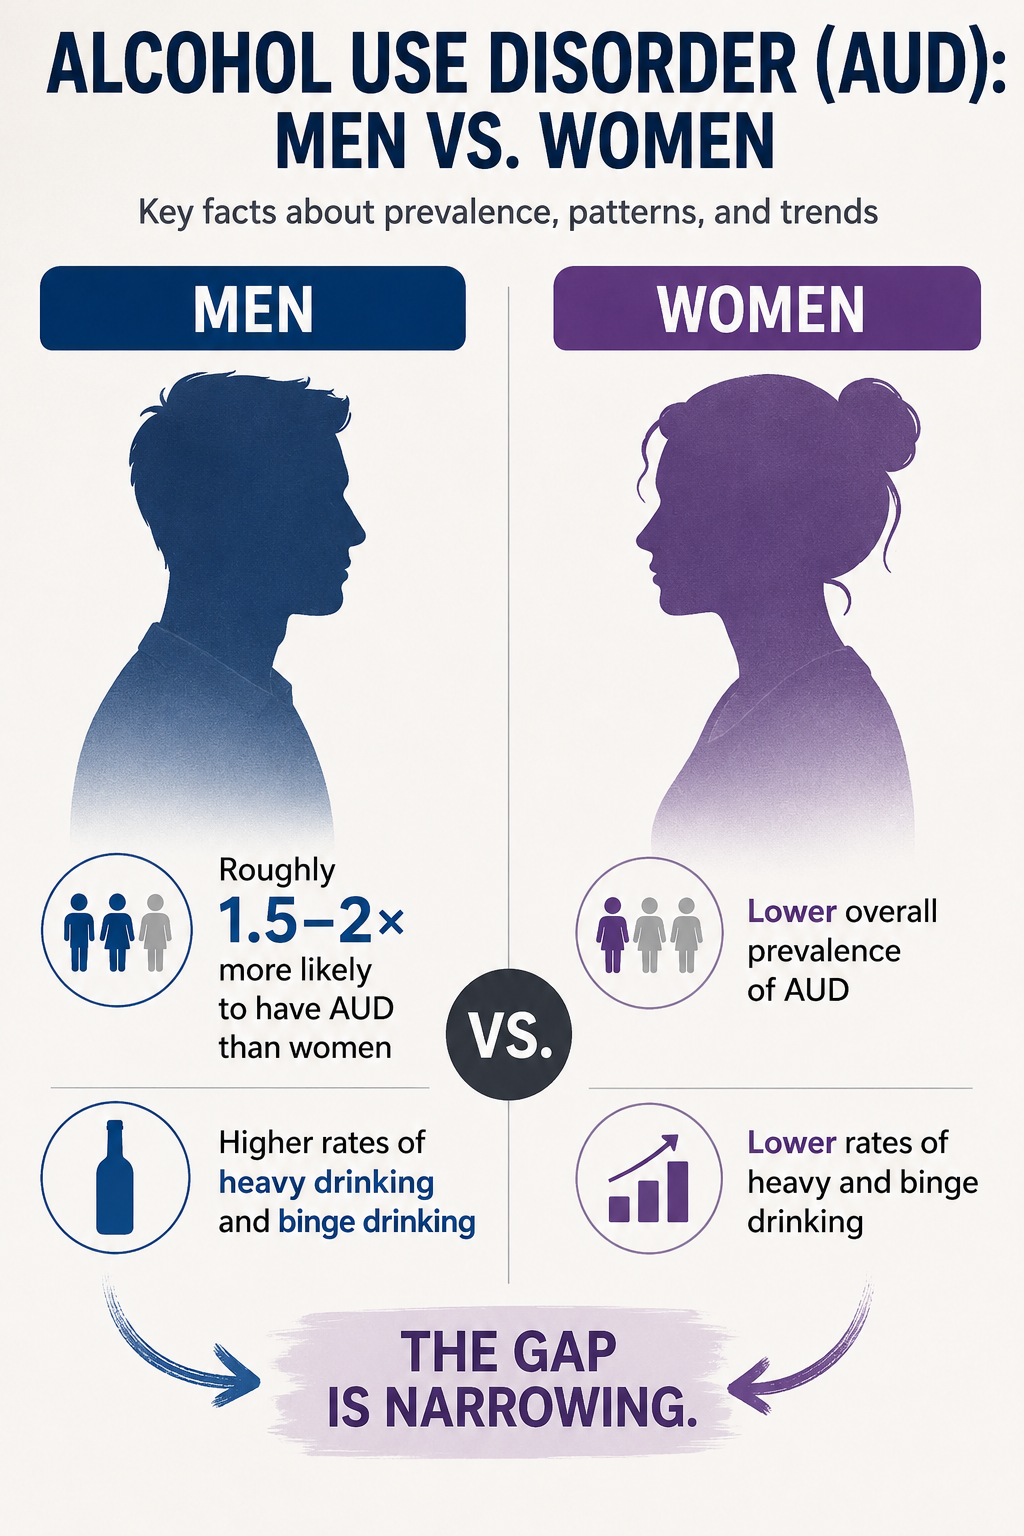
Gender Differences in AUD
Overall Prevalence
According to NIAAA and NSDUH data:
Men remain approximately 1.5–2 times more likely than women to experience AUD.
In 2024, about 11.8% of males ages 12+ met criteria for AUD versus 7.6% of females.
Sources: NIAAA – AUD in the United States: Demographics
Trends Over Time
Researchers report that:
AUD rates among women have increased faster than among men in recent decades.
Younger generations, including Millennials and Generation Z, show a much smaller gender gap in alcohol consumption than older cohorts.
Social norms around women drinking have become more permissive over time.
Sources: NIAAA – Alcohol Use Statistics
Biological Differences
Women generally experience stronger physiological effects from alcohol because they tend to:
Have lower total body water content
Reach higher blood alcohol concentrations per drink
Metabolize alcohol differently
As a result, women may develop alcohol-related liver disease, heart disease, and cognitive impairment at lower levels of consumption than men.
Sources: NIAAA – What Is Alcohol Use Disorder?
Patterns of Harm
Men
Men are more likely to:
Engage in binge drinking
Experience alcohol-related violence and accidents
Consume alcohol in higher quantities overall
Women
Women with AUD are more likely to:
Experience co-occurring anxiety or depression
Progress more rapidly from initial use to dependence (“telescoping effect”)
Experience medical complications sooner
Sources: NIAAA – Alcohol Use Disorder Statistics
Pregnancy & Alcohol Use
Alcohol use during pregnancy can lead to Fetal Alcohol Spectrum Disorders, a group of developmental conditions caused by prenatal alcohol exposure.
Major health organizations advise avoiding alcohol entirely during pregnancy because no known safe level has been established.
Sources: NIAAA Official Website | WHO Official Website
Important Caveats
Variation within demographic groups is often larger than differences between groups.
Some populations may be underrepresented or underreported in surveys.
Demographic categories alone do not explain AUD risk.
AUD results from a complex interaction of biological, psychological, social, and environmental factors.
Sources: NIAAA – Alcohol Facts and Statistics